WNBA Contract Value • Retrospective Accuracy Check

Was the Undervalued Contract Model Right?

This editorial notebook revisits a class-project claim: four WNBA players looked underpaid relative to role, production, and comparable players. The follow-up asks whether the next salary window and another season of performance data confirmed, complicated, or corrected the original read.

1

Methodology toggle

Methodology Show methodology
Salary gap

Compare each target salary to the median salary of selected position/role comps. Median is used to reduce distortion from one extreme contract.

2026 normalization

Because 2026 is a CBA/expansion/free-agency reset, salary is also shown as share of the $7.0M cap.

Performance signal

Role, usage, efficiency, position percentiles, on/off impact, and YoY movement are used to classify whether the original value thesis held up.

Accuracy rubric

The story avoids fake precision. A player can be underpaid, market-corrected, mixed, or incomplete. The goal is not to force every pick into a win column — it is to show analyst judgment.

Significant underpayStrong value edge
Clear underpayValue opportunity
Market-correctedAligned with comps
Mixed / needs check-inMore context required
Improved / validatedPerformance trending up
the model is not graded on being perfect — it is graded on whether the evidence still points in the same direction.

Two tests, one story

Cleaner validation: 2024 stats → 2025 salary. This is the cleanest test of the original undervalued call.

Market reset check: 2025 stats → 2026 salary. Useful, but interpreted as contextual because 2026 salary conditions changed dramatically.

Visual rule: percentile-based skill reads use a gold scale; market/value signals use blue, violet, sand, and coral. That keeps skill strength separate from salary interpretation.

2

Player verdict cards

read each card like a scouting packet — salary signal first, then ask whether the role/performance profile backs it up.
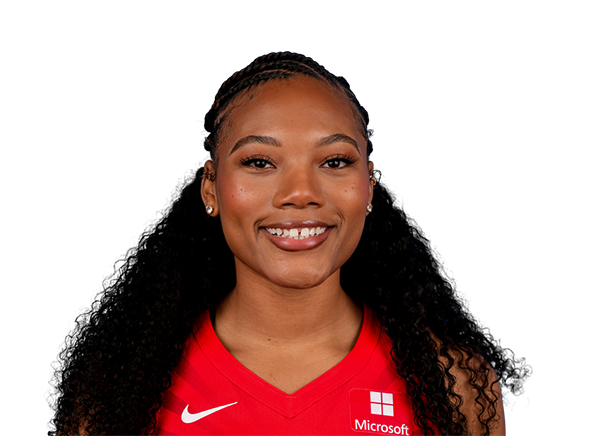
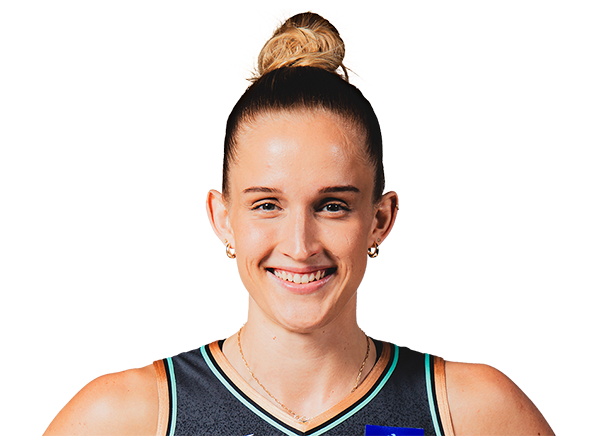
Player headshot: Leonie Fiebich

New York Liberty • Forward

Leonie Fiebich

TS%64.2%
On/Off+107.65
Pts/4012.33
Final accuracyStrong Hit
Elite efficiency and impact stayed intact while the salary gap versus comparable forwards widened in the 2026 market reset.
TS% by position97th 🔥
On/Off impact80th
Assists / 4047th
Steals / 4040th
Blocks / 4036th
Radar profilePosition percentiles + scalability score
Leonie Fiebich radar profile: position percentiles plus scalability confidence TS%StealsBlocksReboundsOn/OffScalability
Scalability5.6/10
Moderate • 56%
2025 Playoffs evidence • small on/off sample

Scalable efficiency flag: elite TS% at low-usage wing volume; playoff evidence keeps the confidence moderate.

Salary signalTarget vs median comp
2025
Target
Comp
-$69K
-50.1%
2026
Target
Comp
-$721K
-71.1%
2025: Significant underpayStrong value edge
2026: Significant underpayStill far below comps
Stable strongImpact profile held
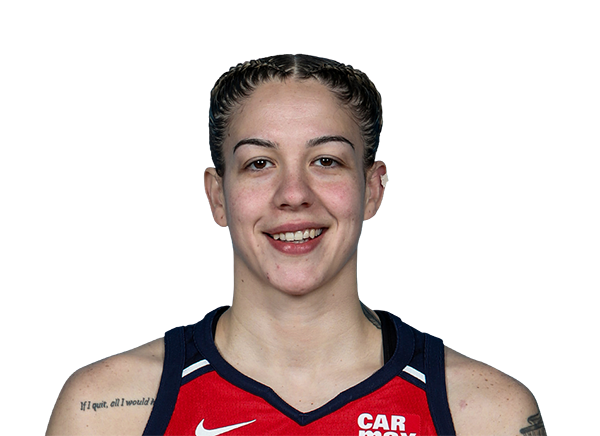
Player headshot: Emily Engstler

Portland Fire • Forward

Emily Engstler

STL/402.17
BLK/402.09
AST/404.49
Final accuracyStrong Hit
The scoring profile cooled, but the value case strengthened through defensive versatility, passing, stocks, and positive on/off movement.
Steals / 4090th
Blocks / 4090th
Assists / 4085th
Def. rating signal76th
Rebounds / 4070th
Radar profilePosition percentiles + scalability score
Emily Engstler radar profile: position percentiles plus scalability confidence TS%StealsBlocksReboundsOn/OffScalability
Scalability6.9/10
Good • 69%
2025 Regular Season evidence • large on/off sample

Scalability comes through defensive versatility: stocks, rebounding, and playmaking travel even when scoring efficiency dips.

Salary signalTarget vs median comp
2025
Target
Comp
-$52K
-39.1%
2026
Target
Comp
-$107K
-27.7%
2025: Significant underpayStrong value edge
2026: Clear underpayValue opportunity
Improved / validatedPerformance trending up
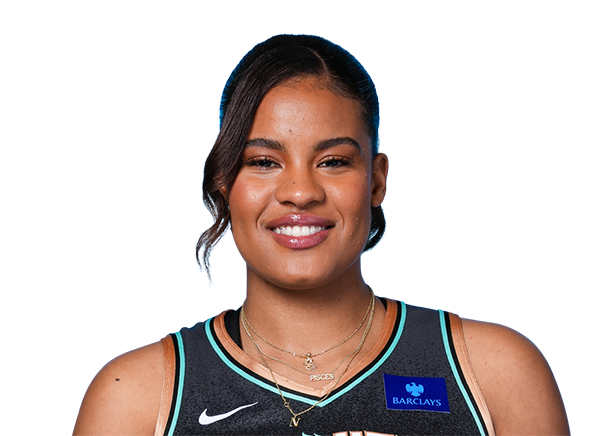
Player headshot: Naz Hillmon

Atlanta Dream • Forward

Naz Hillmon

On/Off+113.09
Pts/4013.79
REB/409.84
Final accuracyMarket-Corrected Hit
Her salary jump looks like market recognition, but role growth and improved all-around production still leave her below median comparable salary.
On/Off impact96th 🔥
TS% by position76th
Assists / 4076th
Rebounds / 4064th
Blocks / 4050th
Radar profilePosition percentiles + scalability score
Naz Hillmon radar profile: position percentiles plus scalability confidence TS%StealsBlocksReboundsOn/OffScalability
Scalability8.8/10
High • 88%
2025 Regular Season evidence • large on/off sample

High-confidence scalability: stronger role, strong efficiency-to-usage balance, and elite team impact signal.

Salary signalTarget vs median comp
2025
Target
Comp
-$15K
-15.4%
2026
Target
Comp
-$255K
-23.3%
2025: Mild underpayNearer to comps
2026: Clear underpayStill below comp market
Improved / validatedRole growth confirmed
Player headshot: Nyara Sabally

Toronto Tempo • Forward / Center

Nyara Sabally

BLK/402.31
On/Off+104.79
REB/4010.44
Final accuracyMixed / Partial Miss
The original 2025 salary gap was real, but her 2026 salary sits above this rebuilt median comp set and the 2025 performance signal is noisy.
Blocks / 4083rd
On/Off impact70th
Rebounds / 4057th
Steals / 4055th
Points / 4035th
Radar profilePosition percentiles + scalability score
Nyara Sabally radar profile: position percentiles plus scalability confidence TS%StealsBlocksReboundsOn/OffScalability
Scalability4.4/10
Moderate • 44%
2024 Regular Season evidence • large on/off sample

Scalability is still possible through rim protection, but the current refresh needs a stronger 2026 check-in.

Salary signalTarget vs median comp
2025
Target
Comp
-$18K
-18.7%
2026
Target
Comp
+$97K
+28.7%
2025: Clear underpayOriginal signal supported
2026: Above compsSalary gap flipped
Mixed / needs check-inMore context required
3

Scalability quadrant

Scalability uses the refresh layer’s confidence score and usage context. It is a directional read: who has room to scale, and who needs a stronger 2026 check-in before the value claim gets louder.

Scalability by usage rate scatterplot 0%6%12%18%24%0%25%50%75%100% * High scalability Proven volume Limited role Volume inefficient FiebichEngstlerHillmonSabally Usage Rate % Scalability Confidence %
4

Cap Share Check: Who Still Costs Less Than Their Comp Market?

Because 2026 salaries reset under a new market structure, cap share gives a cleaner read than raw salary alone. The heat map below keeps the key question simple: is the player being paid like the comp market around them?

Fiebich remains the clearest value gap after normalization: her 2026 salary uses about 4.2% of the cap, while her median comp group sits around 14.5%.
Player
Target Cap Share
Median Comp Cap Share
Market Gap
Leonie Fiebich
4.2%
14.5%
-10.3 ptsMajor underpay
Emily Engstler
4%
5.5%
-1.5 ptsStill below comps
Naz Hillmon
12%
15.6%
-3.6 ptsCloser, still below
Nyara Sabally
6.2%
4.9%
+1.4 ptsAbove median comps
How to read it: blue/teal gaps show players still costing less than their comp market. Coral means the salary gap has flipped above median comps.
Why it matters: this keeps the 2026 CBA jump from drowning the signal. We are comparing market share, not just bigger raw salaries.

Cleaner test: 2024 stats → 2025 salary

Negative bars mean the target player made less than the median of selected comparable players.

Leonie Fiebich
-$68,905
Emily Engstler
-$51,961
Naz Hillmon
-$14,671
Nyara Sabally
-$18,452

Market reset check: 2025 stats → 2026 salary

This is the follow-up signal after the 2026 market reset. It is useful, but not treated as perfect ground truth.

Don’t overfit the chaos year. Use 2026 as a market signal, not a courtroom verdict.
Leonie Fiebich
-$721,490
Emily Engstler
-$106,521
Naz Hillmon
-$255,000
Nyara Sabally
$97,386
5

Final accuracy matrix

PlayerFinal label2025 salary signal2026 salary signalPerformance signal
Leonie FiebichStrong HitSignificant underpaySignificant underpayStable strong / mixed positive
Emily EngstlerStrong HitSignificant underpayClear underpayImproved / validated
Naz HillmonMarket-Corrected HitMild underpayClear underpayImproved / validated
Nyara SaballyMixed / Partial MissClear underpayPaid above median compsDeclined / noisy

Early 2026 check-in placeholder

Add a compact table only: MPG, Usage, TS%, Points/40, key percentile movement, and early signal. Label it directional and update at midseason and end of season.

What the self-audit shows

Fiebich and Engstler are the strongest hits. Hillmon looks market-corrected but still below comparable salary. Sabally is the honest mixed case, which actually strengthens the project because it shows the model is being critiqued, not protected.

Best portfolio line: the point is not “my model was always right.” The point is “I know how to revisit a call when the market changes.”